As part of the analysis of your accounting data, Mamut Validis looks at each individual transaction within a nominal account and identifies any credit or debit values which are exceptionally large, when compared to the other values within the account, or those that fall outside of the normal range. For example, if typical sales are around £500 per transaction a single sale of £1000 would be identified as exceptional.
The Exceptional Values report shows:
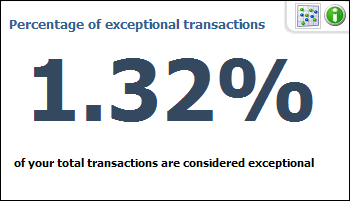
The percentage of all transactions that are considered exceptional.
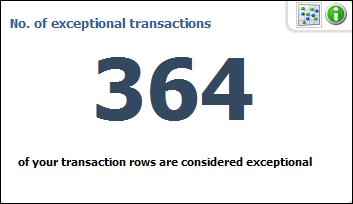
The number of exceptional transactions in your accounting data.
For each nominal account containing exceptional transactions, a chart illustrating the transactions that fall outside of the usual range.
This chart shows the value of transactions. The usual range is shown in green; the four transactions that are considered to be exceptional are shown as red triangles. A list of the exceptional transactions, for each nominal account.
How to view the Exceptional Values report
To view the exceptional values in your accounting data, follow the procedure described below:
Select the menu option Data
Analysis - Summary Analysis-
- Exceptional Values. Alternatively,
select Data Analysis
and then click on the See full
Results link in the Exceptional
Values box. In the Exceptional
Values screen, the percentage and number of exceptional transactions
are shown and a list of the nominal accounts in which they appear.
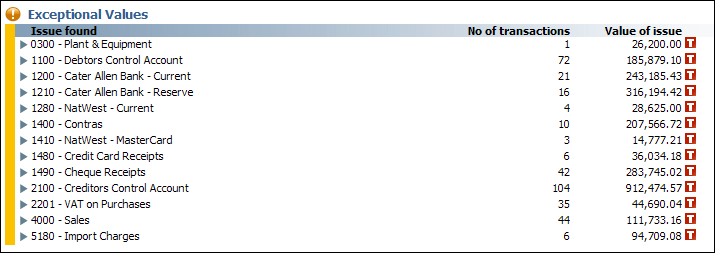

 To
view the underlying transaction details, click on the arrow buttons. When
you first expand the display, Credit and / or Debit options become available.
A further expansion displays a chart showing the usual range of values
(in green) and the exceptional value transactions as red triangles on
a pink background (used to indicate areas above and below the usual range).
Each triangle corresponds to an individual transaction containing an exceptional
value. The transactions are listed below the chart.
To
view the underlying transaction details, click on the arrow buttons. When
you first expand the display, Credit and / or Debit options become available.
A further expansion displays a chart showing the usual range of values
(in green) and the exceptional value transactions as red triangles on
a pink background (used to indicate areas above and below the usual range).
Each triangle corresponds to an individual transaction containing an exceptional
value. The transactions are listed below the chart.
 You can now view the exceptional values report
of your accounting data.
You can now view the exceptional values report
of your accounting data.
Read more about: