In carrying out the unusual combinations analysis, Mamut Validis examines the value of each field within each transaction and identifies what the usual combinations of field values are, and what combinations are unusual.
The Unusual Combinations report shows:
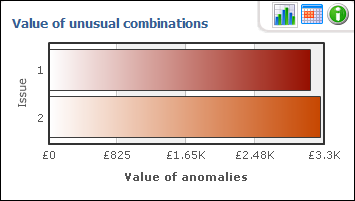
The value of transactions for each unusual combination (or “issue”); available as a chart or as a table.
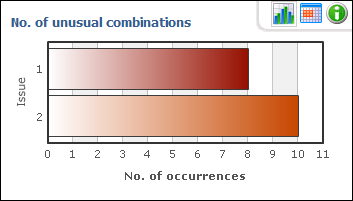
The number of occurrences for each different unusual combination (or “issue”); available as a chart or as a table.
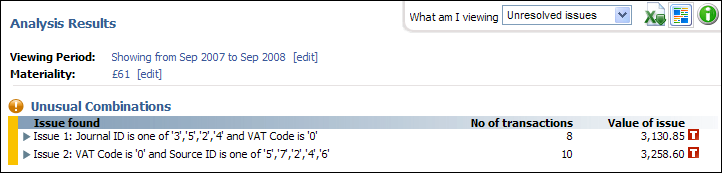
A summary list of “issues”, transactions and values.
How to view the Unusual Combinations report
To view details of transactions with unusual data combinations in your accounting data, follow the steps described below.
Select the menu option Data Analysis - Summary Analysis - Unusual Combinations. Alternatively, select Data Analysis - Summary Analysis - and then click on the See full Results link in the Unusual Combinations box.
 .
. . View Chart/View Table: For the Value of unusual combinations and the
No. of unusual combinations boxes,
in the upper part of the screen, you can switch between a table view and
a chart view of the results by selecting the appropriate buttons.
. View Chart/View Table: For the Value of unusual combinations and the
No. of unusual combinations boxes,
in the upper part of the screen, you can switch between a table view and
a chart view of the results by selecting the appropriate buttons.

 To view details of
the underlying transactions, click on the arrow buttons in the table shown
in the lower part of screen.
To view details of
the underlying transactions, click on the arrow buttons in the table shown
in the lower part of screen.
 You can now view the unusual combinations
report of your accounting data.
You can now view the unusual combinations
report of your accounting data.
When you first expand an issue, a description is shown. A further expansion lists the transactions which contain the corresponding unusual combination.
Read more about: