The Mamut Validis Trends examine your accounting data in order to identify areas where a transaction falls outside of the usual trend of data for its nominal account.
The Trends look at the aggregate value of the transactions that go through a nominal code in each period. If the total value of transactions in one month is significantly different to that of the previous month, or significantly different to the average aggregate balance, the trend is deemed to have been broken.
If your accounting data appears to contain any broken trends, Mamut Validis identifies every transaction that makes up the balance in question. These are then displayed, so that you can check to see if there are any anomalous entries that have caused the trend to break, or confirm that all the transactions are legitimate.
For example, trends that may be identified as being abnormal include:
Excessive spending in an expense account.
Lack of sales activity.
Mis-posted transactions may mean a trend has been accidentally broken and the item can then be spotted.
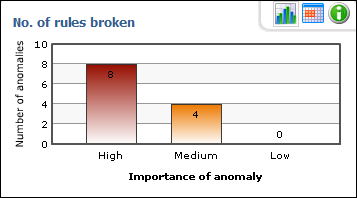
Mamut Validis reports any breaches of these rules as potential anomalies and groups them according to the relative importance of the nominal code in which the trend has been broken.
The Trend Rules report shows:
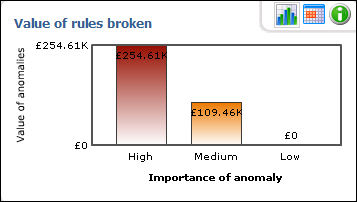
The value of all transactions that break the trend rules, grouped by the importance of the rule; available as a chart or as a table.
The number of different trend rules broken, grouped by the importance of the rule; available as a chart or as a table.
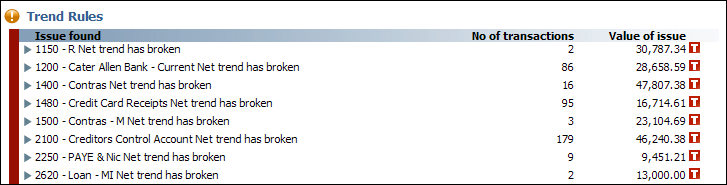
A list of the transactions identified as potential anomalies, for each rule; with the transactions listed in value order, highest first, as it is often the larger values that have skewed the results.
How to view the Trend Rules Report
To view potential breaches of trend rules in your accounting data, follow the steps described below.
Select the menu option Analysis Reports - Summary - Trend Rules. Alternatively, select Analysis Reports - Summary and then click on the See full results link in the Trend Rules box. The Trend Rules screen is displayed.
 .
. .Chart View/Table View: For the Value of trends broken and the No. of trends broken boxes, in the upper
part of the screen, you can switch between a table view and a chart view
of the results by selecting the appropriate buttons.
.Chart View/Table View: For the Value of trends broken and the No. of trends broken boxes, in the upper
part of the screen, you can switch between a table view and a chart view
of the results by selecting the appropriate buttons.

 To
view details of the underlying transactions, click on the arrow buttons
in the table shown in the lower part of screen.
To
view details of the underlying transactions, click on the arrow buttons
in the table shown in the lower part of screen.
 You can now view the trend rules report of
your accounting data.
You can now view the trend rules report of
your accounting data.
 Note! When you first expand a rule
a graph is displayed, showing the trend in transaction values over time
for the selected item. On this graph, red points on a green background
show months in which the usual pattern of transactions was observed. Blue
points shown outside the green range show months in which transactions
broke the usual trend. Beneath the graph is a list of the months in which
the trend was broken. Expanding this list displays the underlying transactions
for the selected month.
Note! When you first expand a rule
a graph is displayed, showing the trend in transaction values over time
for the selected item. On this graph, red points on a green background
show months in which the usual pattern of transactions was observed. Blue
points shown outside the green range show months in which transactions
broke the usual trend. Beneath the graph is a list of the months in which
the trend was broken. Expanding this list displays the underlying transactions
for the selected month.
Read more about: