About the Pivot Table
The Pivot Table is the functionality which as a standard accompanies Microsoft Excel. This is an interactive table which automatically organises data from the Mamut Systems.
If you are not familiar with the Pivot Table we recommend that you read more about how to use these on the Microsoft website: http://office.microsoft.com/en-gb/excel/HP052743561033.aspx (external link).
Selecting figures in the Pivot Table
A number of figures and carriers will be visible in the Pivot table in Excel. You can use the functions in Excel for analysis by creating the tables and graphical presentations you want, and selecting the data carrier and diagrams/graphs to illustrate the figures.
Example:
You can set up an analysis of sales of the most important products distributed by sales person, customer, distributor and supplier (some of the suppliers are also wholesalers), and illustrate these graphically. Most of these figures already appear in the columns of the Excel sheet that has been created.
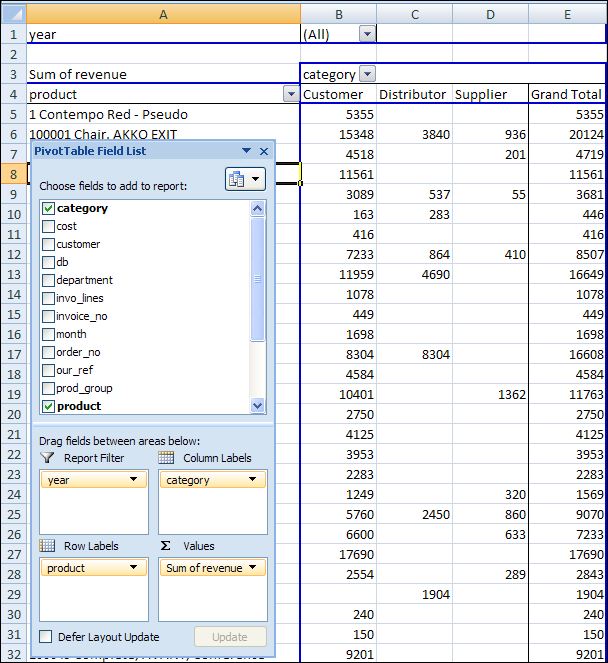
Add "our_ref" to the carrier, which is sales per sales person, from the PivotTable Field List. You do this by selecting the carrier and clicking Add to and selecting Row area from the drop-down list. Alternatively, you can select "our_ref" in PivotTable Field List and drag it to the row area in the table in the Excel sheet (next to the product row).
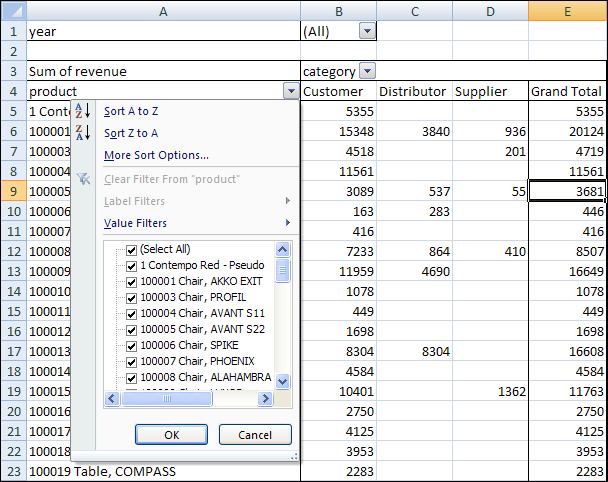
You can then use the four best-selling products in the analysis. You will see the sales figures for all the products in the table in the Excel sheet. Select the four best-selling products in the drop-down menu in the Product cell.
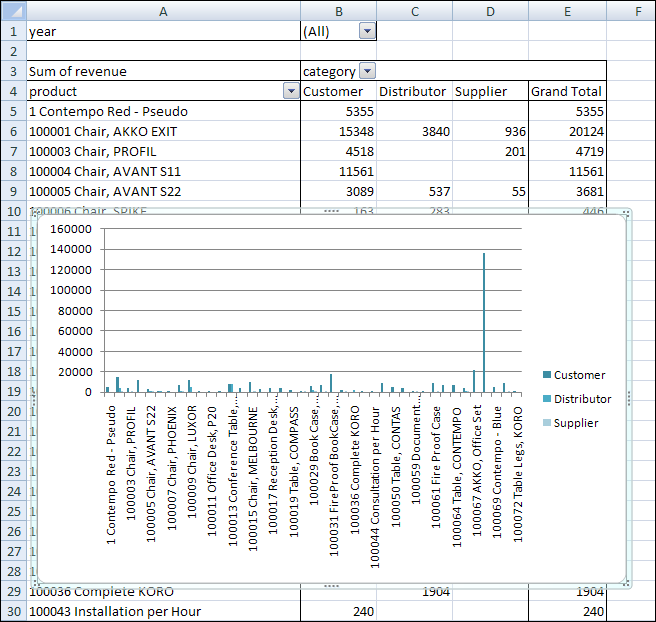
Graphical display of figures in the Pivot table
With the Pivot table functions in Microsoft Excel you can also illustrate the figures graphically. A new Excel sheet with a bar chart based on the figures in the table is generated.
Pivot tables can seem complicated, but once you have mastered the technique, there are countless possibilities. The tables allow you to make all possible category combinations from the key figures in Mamut Business Software, so that you quickly find the connections you are looking for in relation to your business activities.
Feel free to read up on how to use Pivot tables in Excel on the Microsoft web pages, after a little bit of practice it is simple to master the functions. The following link is useful for getting started with Pivot tables: http://office.microsoft.com/en-gb/excel/HA010346321033.aspx(external link).
Read more about: