Exporting Company Analysis to Excel
View - Status - Export Company
Analysis to Excel ![]()
![]() Note! Mamut Enterprise Business Intelligence
exports enable you to export business-critical figures from your database
to tables in Microsoft Excel ready for analysis (requires minimum Microsoft
Excel 9.0). This provides you with an alternative to standard reports,
enabling you to see connections you do not find in the Report module.
Note! Mamut Enterprise Business Intelligence
exports enable you to export business-critical figures from your database
to tables in Microsoft Excel ready for analysis (requires minimum Microsoft
Excel 9.0). This provides you with an alternative to standard reports,
enabling you to see connections you do not find in the Report module.
The export is carried out by the help of a wizard, where from you select the accounting year and data to be included in the report. You can select combinations of information from the:
- Customer ledger
- Supplier ledger
- Order and Invoicing
- Customer/Contact information
- Product
- Accounting
The Export Wizard
Start the wizard by selecting View - Status and Export Company Analysis to Excel.
- Select
an accounting year from the drop-down list. The export will include and
compare figures from this year with the previous year (the year before
the one you have selected here).
Click Next. - Select which data you wish to base the analysis on.
Separate spreadsheets will be created in a workbook for each category.
Click Next to start the export.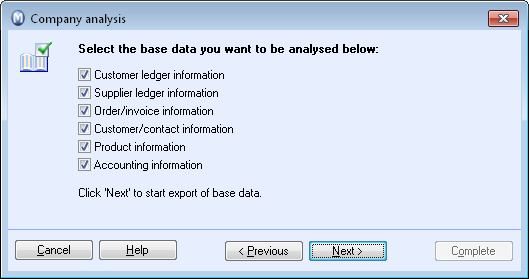
Figures from all the selected categories are exported and ready for transfer to Excel.
- Click Complete to transfer the data to Microsoft Excel. When the spreadsheet is ready, Excel opens automatically.
![]() You can now compile the data or import them
into the calculations you want. Remember to save the Excel sheet somewhere
you can easily retrieve it. Separate spreadsheets will be created in one
workbook for each report. A front page will be automatically generated
and the workbooks are formatted in such a way that each report fits one
page. All you have to do is print and staple together the sheets to make
one booklet which you can distribute.
You can now compile the data or import them
into the calculations you want. Remember to save the Excel sheet somewhere
you can easily retrieve it. Separate spreadsheets will be created in one
workbook for each report. A front page will be automatically generated
and the workbooks are formatted in such a way that each report fits one
page. All you have to do is print and staple together the sheets to make
one booklet which you can distribute.
Default reports
The reports are displayed on the different tabs in the Excel spreadsheet.
Customer Ledger: The report Customer Ledger Statistics displays opening and closing balances for both the current year and the previous year as well as age groupings and customer ledger statistics.
Supplier: The report Supplier Ledger Statistics displays opening and closing balances for both the current year and the previous year as well as age groupings in the supplier ledger.
Invoice: The report Invoice and Turnover Statistics displays the turnover by period and by product group.
40 Customers: The report 40 Largest Customers contains the sales totals for the 40 largest customers for the current year and for all years.
40 Products: The report 40 Largest Products contains the sales totals for the 40 best-selling products for the current year and for all years.
Statistics: The report Registration Statistics displays an overview of journal entries, contacts and orders/invoices that have been registered during the year.
Read more about: